SP500
Trend Signal Turn Dates for S&P500
Submitted by Van Beek on July 26, 2014 - 09:45One of our readers aksed on what dates the MATI trend signal for the S&P 500 turned durring the last few decades.
Here is a table that shows on what dates the MATI signal turned up and down and what the level was of the S&P 500 at that moment.
S&P 500 Performance History and Month-end Trend Signal
Submitted by Van Beek on May 9, 2012 - 12:23
The chart below shows the development in the monthly closing price of the S&P 500.
The red and green lines indicate the “Up” and “Down/Warning” signals as generated by the Month-end Trend Signal.
You can download a larger version of the chart below at the bottom of this page. Or click and drag the chart to a new tab in your browser.
S&P 500 Moving Averages Signals
Submitted by Van Beek on May 9, 2012 - 12:21
The chart below shows the latest status and the history during the last few years for the following S&P 500 Trend Signals.
The chart has been updated after the closing of April 2012.
S&P 500 Trend Investing and Long-term Market Timing Signals
Submitted by Van Beek on May 9, 2012 - 12:14You can find here the latest
updated long-term
Trend Signals for the S&P 500.
Every month, these S&P 500
Trend Signals are updated.
The last update happened in May 2012 after the closing of April 2012.
Trend Signals for the S&P 500 tell long-term investors when the trend is up and when it is down.
When you want to make money, you want to own or be invested in funds when the trend is up and
do not have any funds or short the market when the trend is down.
S&P 500 Stock Investing Infographics
Submitted by Van Beek on April 11, 2012 - 15:53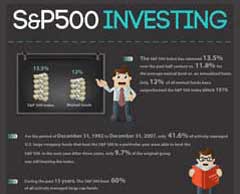
See below the ultimate S&P 500 Stock Investing Infographics.
Click on the infographics to see the larger version and get here the S&P 500 trend signal email alert.
S&P 500 Rallies and Still Loses in November 2011
Submitted by SP 500 on December 2, 2011 - 09:05|
During periods like now, when markets fluctuate multiple percentages per day, it is easy to lose the overview of the real direction that the market is moving.
|

S&P 500 lost over 12% in 2 Months
Submitted by SP 500 on October 4, 2011 - 15:59|
Despite some of the best days every, the S&P 500 has lost more than 12% during the last 2 months. The 3 months before that, it had lost already 5% since its peak end of April. This situation is a good example that trend signals are not capable to tell you if the market is at its top. But long-term trend signals can tell you when the long-term trend has turned down. Nobody knew in May orJune that April was the peak. |
You Need More than the S&P 500 to See the US Market Trend
Submitted by SP 500 on August 1, 2011 - 11:16After a hectic month, with
- a US debt default discussion,
- a rescue package for Greece and
- signs of slower than expected economic growth
The long-term trend signals for the S&P 500 are all unchanged compared to last month.
They are all pointing up.
But this is a time that shows clearly that looking at the long-term trend signals for one market index like the S&P 500 is not enough.
To see where the trend is going for the overall market, you better follow a number of different market indices.
At this moment we get for example the first warnings from the NASDAQ and NYSE indices for the start of a potential downturn.
Long-term trend signals for many emerging markets are pointing down. And Europe starts coloring red as well.
S&P 500 Index Investing - lost 1.35% during May 2011 - but what is it YTD and YoY?
Submitted by SP 500 on June 1, 2011 - 12:34
The S&P 500 has been growing your savings in dollars over the last year.
During the month of May 2011, the S&P 500 lost 1.35%. By the end of May, however, the S&P 500 gained 7% so far this year.
Year-on-year, compared to end of May 2010, the S&p 500 is up 23%.
Click here to see the S&P 500 history chart.
We publish every month the updated long-term trend indicators for the S&P 500 on this website.
S&P 500 Trend Following May 2011 Update
Submitted by SP 500 on May 6, 2011 - 07:53All the long-term Trend Signals for the S&P 500 are pointing up after the closing of April 2011.
Investors who are trend following the S&P 500 can take it easy during May.
However, the different stock market indices are normally moving very much in tandem.
And for the NASDAQ, one of our custom-developed trend signals, the MATI, indicated an increased risk for a pullback. Such a pullback could last weeks or months. And a pullback in the NASDAQ is unlikely to happen without a pullback in the S&P 500.
Therefore, investors can be cautious to allocate more money or to start investing in the US markets at this moment.

