SP500
S&P 500 Long Term Trends April 2011 Update
Submitted by SP 500 on April 5, 2011 - 06:00Boring... the S&P 500 ended March 2011 about as it began the month. It is up 0.2%.
Long-term trends in stock market indices are boring. They change in general very little. In most months, there is nothing new to tell. It is the same this month. The world is in turmoil, with revolutions in the Middle East and Norhern Africa and a terrible disaster in Japan.
But in the long-term trend for the S&P 500, there is no change.
The 4 different S&P 500 Trend Signals are all pointing up-wards.
Click here for the updated Trend Signal overview and for the links to the S&P 500 history charts.
Get trend signals for other indices, by signing up for our free newsletter and by trying our risk-free trial membership for the Stock Trend Investing System.
S&P 500 Long Term Trends and March 2011 Update
Submitted by SP 500 on March 1, 2011 - 08:43The S&P 500 gained 2.85% during February 2011.
There is no change in the long-term trend indicators for the S&P 500 between the beginning of February 2011 and the beginning of March 2011.
The 4 different S&P 500 Trend Signals are all pointing up-wards.
Click here for the updated Trend Signal overview and for the links to the S&P 500 history charts.
Get trend signals for other indices, by signing up for our free newsletter and by trying our risk-free trial membership for the Stock Trend Investing System.
What do the S&P 500 Trend Signals Tell Us Now
Submitted by SP 500 on February 2, 2011 - 05:57
This video shows what the different Trend Signals tell us about the long-term trend in the S&P 500 at this moment.
The video explains also the different trend signals for the S&P 500 that are made available every month free of charge.
If there is something not clear or you have a question related to this video, please leave a comment.
How Much did the S&P 500 Gain in January and is the Trend "Up"?
Submitted by SP 500 on February 1, 2011 - 11:09During January 2011, the S&P 500 gained 2.3%. The Trend Signals for the S&P 500 are all still the same as last month. They all indicate that the direction of the long-term trend in the S&P 500 is “up” at this moment.
If you consider stepping into the market at this moment, please remember that this “up” trend is going on already for a while. When you enter the market in smaller steps, you limit your risk in case the trend turns around abruptly.
See here our free and simple Money Management tool.
How to Get Better Annualized Returns from Your S&P 500 Index Funds?
Submitted by Van Beek on January 17, 2011 - 10:57
Click here for the latest S&P 500 trend investing and long-term market timing signals.
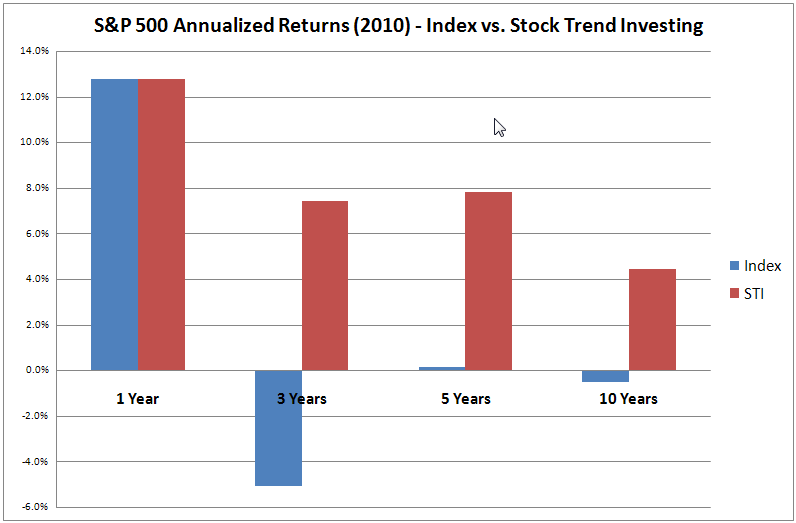
The return of the S&P 500 over 2010 was good: 13%. However, the annualized returns of the S&P 500 for the last 3, 5 or even 10 years are very poor. Just buying and holding an S&P 500 index fund does not make financial sense. However, with trend investing and long-term market timing, investing in the S&P 500 does start making sense.
SP500 Performance History

In the beginning of 2000, I had a close look at the SP500 performance history. The conclusion was clear. I had to start investing in the stock market. I was making a decent salary, but all my friends were making a fortune with their stock market investments.
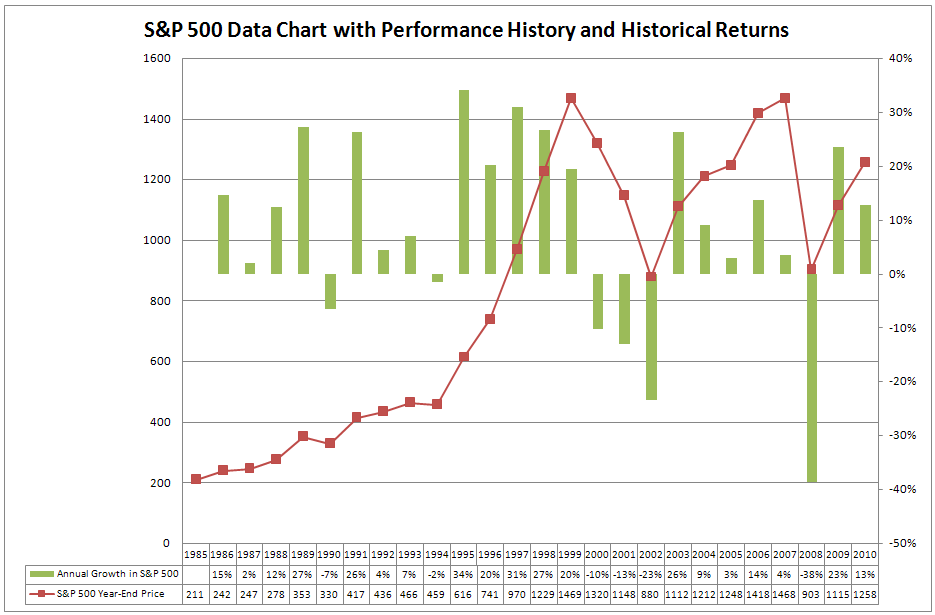
It was time that I started to invest my savings in the stock market as well. I took action. The rest is history. The performance of the SP500 in the year 2000 was a minus 10%.
SP500 Data Chart

In January 2000, I took a good look at the SP500 data chart. The conclusion was obvious. I had to start investing in the stock market. My salary was fine but everyone around me was making a fortune more in the stock market.
Standing idle was no longer an option for me and I started to invest my savings in the stock market. That did not turn out well as you can see in the chart. The SP500 data shows for the year 2000 a result of minus 10%.
The SP500 data in the chart above shows also that during 1990 and 1994, the SP500 turned negative and that these years were followed by years with excellent results. With this data in mind, I had nothing to fear. Reality proved me wrong.
Historical SP500 Returns

To see a larger version of this historical SP500 returns chart, download the attachment at the end of this page or click and drag the chart to a new tab in your browser.
When I reviewed in January 2000, the historical SP500 returns, I came to the conclusion that I was mad not investing in the stock market. I was earning a good wage. But my friends were making way much more money with their stock market investments.
I could no longer stand on the sideline and started to invest my savings in the stock market. We all know what happened after that. The returns of the SP500 in the year 2000 were a minus 10%.


