returns

Historical SP500 Returns
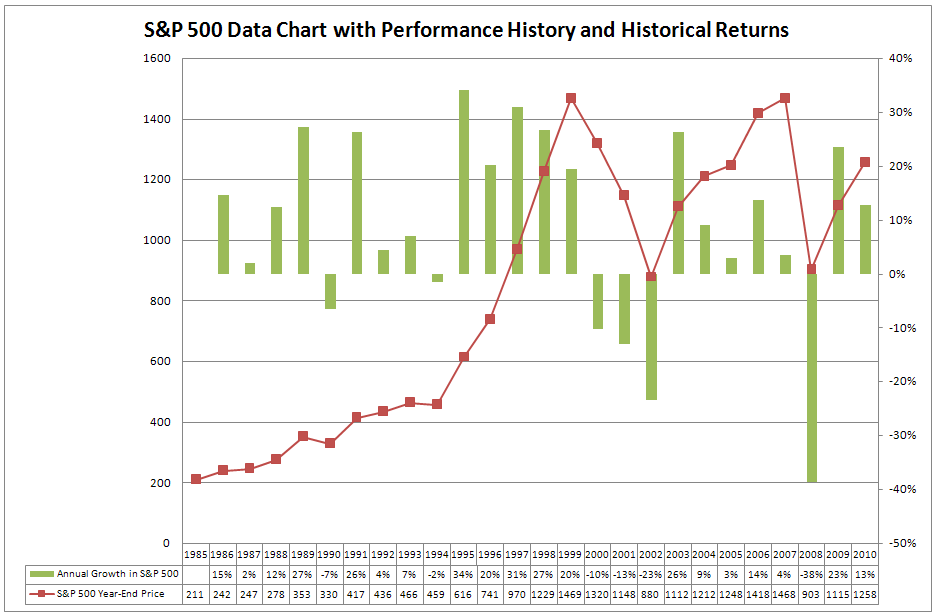
Historical SP500 Returns Chart

To see a larger version of this historical SP500 returns chart, download the attachment at the end of this page or click and drag the chart to a new tab in your browser.


When I reviewed in January 2000, the historical SP500 returns, I came to the conclusion that I was mad not investing in the stock market. I was earning a good wage. But my friends were making way much more money with their stock market investments.

I could no longer stand on the sideline and started to invest my savings in the stock market. We all know what happened after that. The returns of the SP500 in the year 2000 were a minus 10%.

What are the Typical Trend Investing Returns?

Trend Investing can give you a substantially better return than Buy & Hold Investing.  Over a period of 18 years, S&P 500 Trend Investing turns $10,000 into $49,438.  As a Buy & Hold investor, you would yield only $28,262. Trend Investing gives you here a 212% higher return on the initial investment than Buy & Hold investing.


Syndicate content

Get Better Trend Trading and Index Investing Results


Disclaimer

The information contained on this website and from any communication related to this website is for information purposes only. We do not make recommendations for buying or selling any securities or options. We make financial suggestions and it is up to the visitors to make their own decisions, or to consult with a registered investment advisor when evaluating the information on Stock Trend Investing. Read more...