- End of 12 Years of Monthly Stock Market Trend Updates
- Alternative Services for Trend Signals
- S&P 500 Trend Signal Email Alert
- Two Favorite Economics and Investment Newsletters
- Get Email Alert When S&P500 Trend Turns Down
- Currencies Impact Stock Market Profits
- Trend Investing Whip-Saw Reality
- Not Trend Following But Trend Investing
- How to Invest My Savings Safely for Good Long-Term Returns?
- Does Trend Trading the ASX Work?
returns
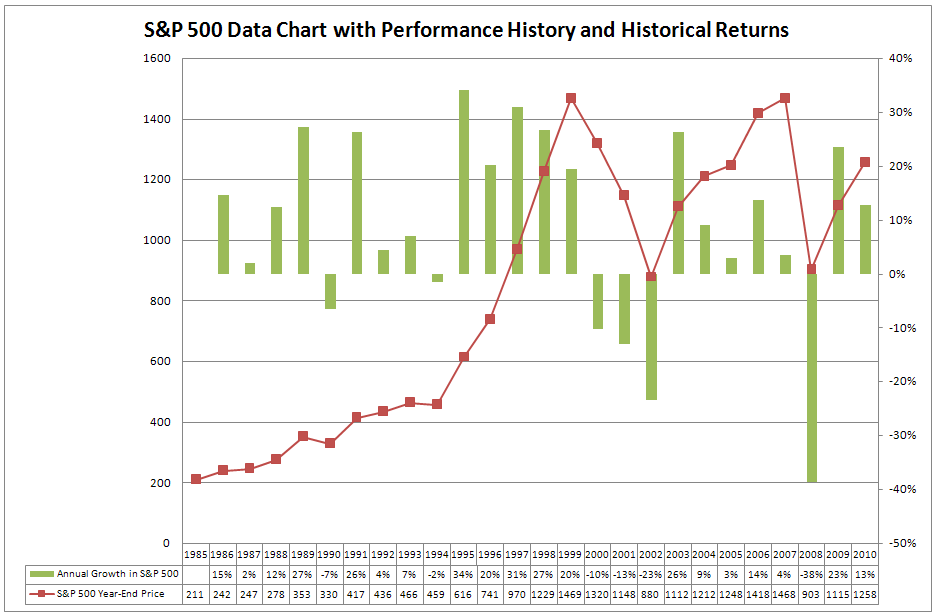
Historical SP500 Returns

To see a larger version of this historical SP500 returns chart, download the attachment at the end of this page or click and drag the chart to a new tab in your browser.
When I reviewed in January 2000, the historical SP500 returns, I came to the conclusion that I was mad not investing in the stock market. I was earning a good wage. But my friends were making way much more money with their stock market investments.
I could no longer stand on the sideline and started to invest my savings in the stock market. We all know what happened after that. The returns of the SP500 in the year 2000 were a minus 10%.
What are the Typical Trend Investing Returns?
|
