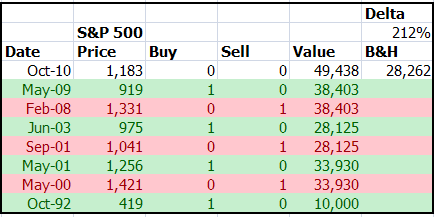
Trend Investing can give you a substantially better return than Buy & Hold Investing. Over a period of 18 years, S&P 500 Trend Investing turns $10,000 into $49,438. As a Buy & Hold investor, you would yield only $28,262. Trend Investing gives you here a 212% higher return on the initial investment than Buy & Hold investing.
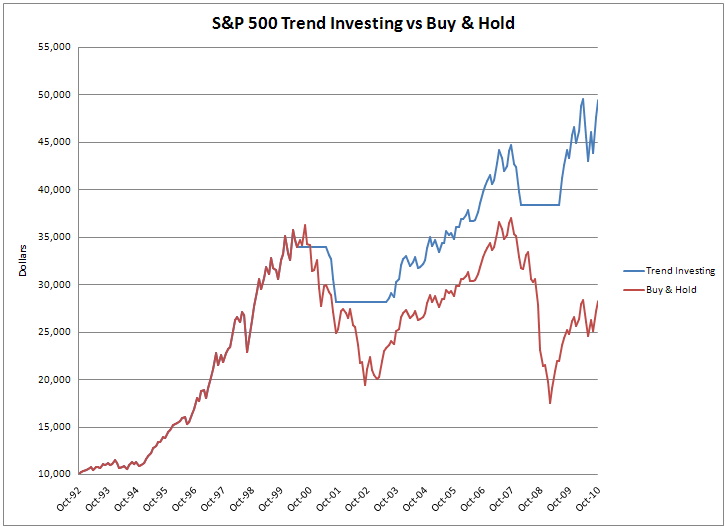
S&P 500 Trend Investing returns beat the Buy & Hold Returns easily.
See the latest annualized returns for the S&P 500 here.
It is not possible to give you a projection for the typical returns that Stock Trend Investing will deliver to you. The exact Trend Investing returns depend on:
- The length of the period that you consider
- The price development of the market index in which you invest
- The number of investment steps that you take to enter and exit the market
What Period Length
Trend Investing is a long term approach. This is not a strategy for just a year or two. This is a way of investing for a decade or preferably longer since the trends that you capitalize on last for many years.
In the examples here, you look at a period of 18 years-and during this period, you would have traded only 8 times: 4 times you bought and 4 times you sold.
Which Market Index
Some market indices are more volatile than others. The historic tops and bottoms of the NASDAQ, for example, have been much wider apart in percentage points than the tops and bottoms of the Dow Jones. Thus if this continues, you can make larger gains in the NASDAQ than in the Dow. However, the value of you holdings can also fluctuate more and the risk is higher.
How Many Investment Steps
Maybe you are an investor who likes bold action and you move in and out of a market all at once with all you want to invest. Thus, if a market signals to you its first buy signal after a previous sell signal, you may decide to step in with all the money that you want to invest in that market. And when the first sell signal comes for a certain market, you immediately sell all you have invested.
Or maybe you feel better if you take smaller steps. After the first buy signal, you may enter the market in two or three steps. During each step you only buy using a portion of the money that you have earmarked to invest in total in that market. And when you sell your holdings you may work in the same way.
Your exact returns depend on how bold you enter and exit the markets. In the example below we assume for simplicity that you enter and exit the market every time in one step.
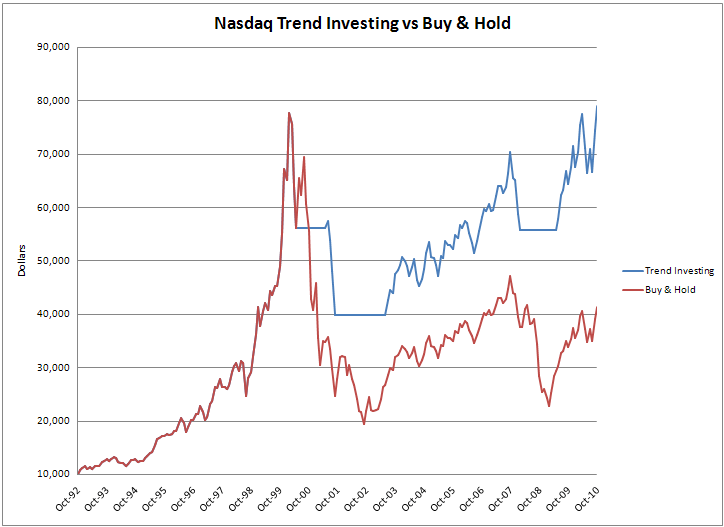
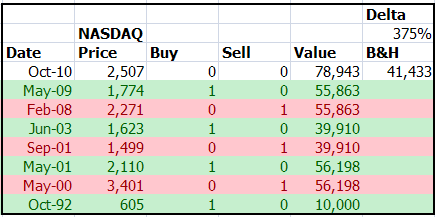
NASDAQ Trend Investing returns exceed the Buy & Hold returns.
18 Years of Trend Investing in the U.S. Markets: 222% Higher ROI
Here is a specific example: You take the U.S. market indices from October 1992 through October 2010. During that period, Trend Investing provides a Return On Investment (ROI) that is on average 222% higher than a Buy & Hold approach.
If you are interested in this level of returns for yourself, start your risk-free trial now and receive simple Trend Investing and Market Timing signals without any obligations.
The table below shows how much money you would have after 18 years of Trend Investing or Buy & Hold Investing if you started with $10,000 in October 1992. The Higher ROI column shows how much higher the Trend Investing return is of your original $10,000 compared to the Buy & Hold approach.
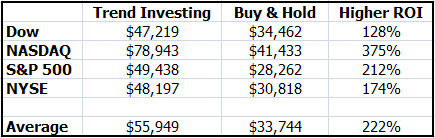
Trend Investing delivers on average 222% higher returns
The table above also shows how, for example, the difference in volatility between the NASDAQ and Dow Jones results in a quite different ROI. In general, however, Trend Investing outperforms Buy & Hold for each of the indices. In addition, Trend Investing the Dow still gives you better returns than Buying & Holding the NASDAQ.
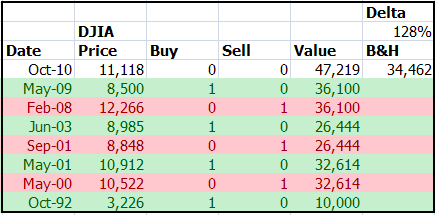
The tables below show you for each of the main U.S. Stock Market indices (Dow Jones, NASDAQ, S&P 500, NYSE) the following:
- Date: The months during the last 18 years that the Stock Trend Investing system generated a new Buy or Sell signal.
- Price: The closing price of the index that month
- Value: The value of the Trend Investing holding at the end of that month (start capital in this example is $10,000)
- B&H: The value of your holding after 18 years of Buy & Hold
- Delta: The higher ROI that Trend Investing provides compared to Buy & Hold
Dow Jones Industrial Averages
NASDAQ
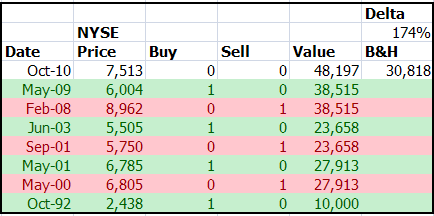
NYSE
S&P 500
Next Step...
Contact us if you have specific questions for Trend Investing returns for European and Asian market indices.
When you are interested in outperforming the stock market using just a few minutes a month, start your risk-free trial now and receive simple Trend Investing and Market Timing signals. It is up to you whether or not you act on them.
|