S&P 500 Stock Investing Infographics
Submitted by Van Beek on April 11, 2012 - 15:53
See below the ultimate S&P 500 Stock Investing Infographics.
Click on the infographics to see the larger version and get here the S&P 500 trend signal email alert.
Thanks to caxtonfx.com for helping us to get this infographics.
See below all the text that is used in this stock investing infographics.
S&P 500 Stock Investing Information
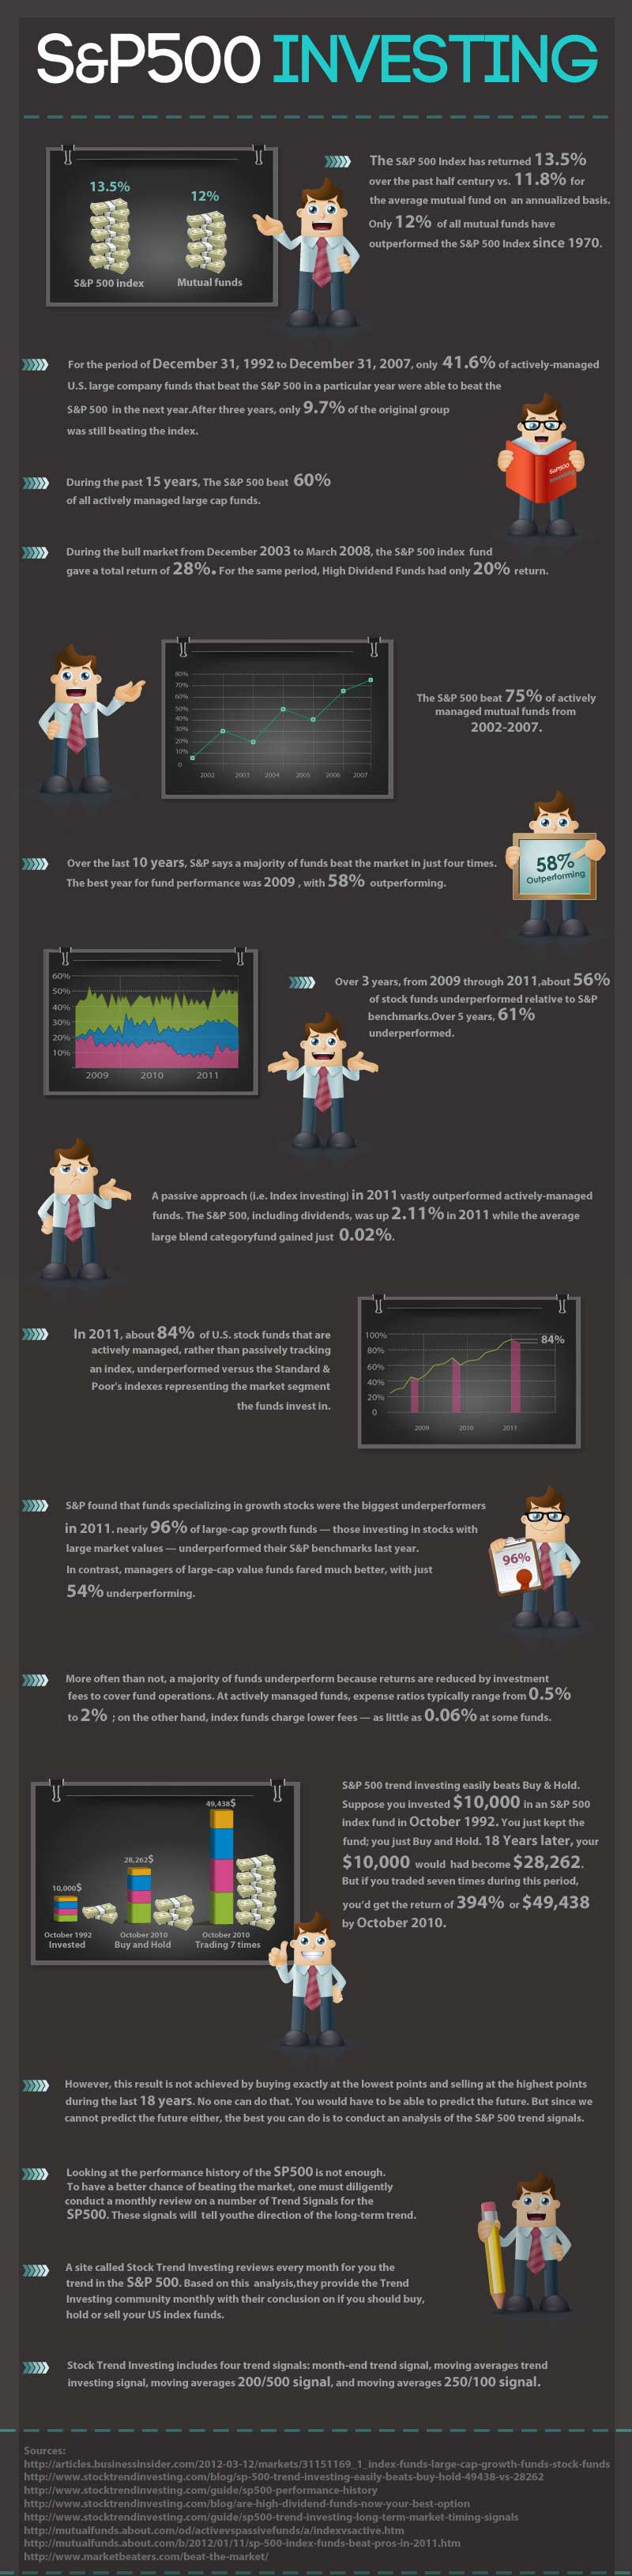
- The S&P 500 Index has returned 13.5% over the past half century vs. 11.8% for the average mutual fund on an annualized basis.
- Only 12% of all mutual funds have outperformed the S&P 500 Index since 1970.
- For the period of December 31, 1992 to December 31, 2007, only 41.6% of actively-managed U.S. large company funds that beat the S&P 500 in a particular year were able to beat the S&P 500 in the next year. After three years, only 9.7% of the original group was still beating the index.
- The S&P 500 beat 75% of actively managed mutual funds from 2002-2007.
- During the bull market from December 2003 to March 2008, the S&P 500 index fund gave a total return of 28%. For the same period, High Dividend Funds had only 20% return.
- During the past 15 years, The S&P 500 beat 60% of all actively managed large cap funds.
- Over the last 10 years, S&P says a majority of funds beat the market in just four times. The best year for fund performance was 2009, with 58 percent outperforming.
- Over three years, from 2009 through 2011, about 56 percent of stock funds underperformed relative to S&P benchmarks. Over five years, 61 percent underperformed.
- A passive approach (i.e. Index investing) in 2011 vastly outperformed actively-managed funds. The S&P 500, including dividends, was up 2.11% in 2011 while the average large blend category fund gained just 0.02%.
- In 2011, about 84 percent of U.S. stock funds that are actively managed, rather than passively tracking an index, underperformed versus the Standard & Poor's indexes representing the market segment the funds invest in.
- S&P found that funds specializing in growth stocks were the biggest underperformers in 2011. nearly 96 percent of large-cap growth funds — those investing in stocks with large market values — underperformed their S&P benchmarks last year. In contrast, managers of large-cap value funds fared much better, with just 54 percent underperforming.
- More often than not, a majority of funds underperform because returns are reduced by investment fees to cover fund operations. At actively managed funds, expense ratios typically range from 0.5 percent to 2 percent; on the other hand, index funds charge lower fees — as little as 0.06 percent at some funds.
- S&P 500 trend investing easily beats Buy & Hold. Suppose you invested $10,000 in an S&P 500 index fund in October 1992. You just kept the fund; you just Buy and Hold. 18 Years later, your ten thousand dollars would had become $28,262. But if you traded seven times during this period, you’d get the return of 394% or $49,438 by October 2010.
- However, this result is not achieved by buying exactly at the lowest points and selling at the highest points during the last 18 years. No one can do that. You would have to be able to predict the future. But since we cannot predict the future either, the best you can do is to conduct an analysis of the S&P 500 trend signals.
- Looking at the performance history of the SP500 is not enough. To have a better chance of beating the market, one must diligently conduct a monthly review on a number of Trend Signals for the SP500. These signals will tell you the direction of the long-term trend.
- A site called Stock Trend Investing reviews every month for you the trend in the S&P 500. Based on this analysis, they provide the Trend Investing community monthly with their conclusion on if you should buy, hold or sell your US index funds.
- Stock Trend Investing includes four trend signals: month-end trend signal, moving averages trend investing signal, moving averages 200/500 signal, and moving averages 250/100 signal.
Infographics Sources
- http://articles.businessinsider.com/2012-03-12/markets/31151169_1_index-funds-large-cap-growth-funds-stock-funds
- http://www.stocktrendinvesting.com/blog/sp-500-trend-investing-easily-beats-buy-hold-49438-vs-28262
- http://www.stocktrendinvesting.com/guide/sp500-performance-history
- http://www.stocktrendinvesting.com/blog/are-high-dividend-funds-now-your-best-option
- http://www.stocktrendinvesting.com/guide/sp500-trend-investing-long-term-market-timing-signals
- http://mutualfunds.about.com/od/activevspassivefunds/a/indexvsactive.htm
- http://mutualfunds.about.com/b/2012/01/11/sp-500-index-funds-beat-pros-in-2011.htm
- http://www.marketbeaters.com/beat-the-market/
Sign up for our free email newsletter and get more useful stock investing information like this S&P 500 Infographics.

Next & Previous Blog Post
- ‹ previous
- 142 of 174
- next ›
