trading
Nasdaq Historic Trend Trading Chart - March 2010
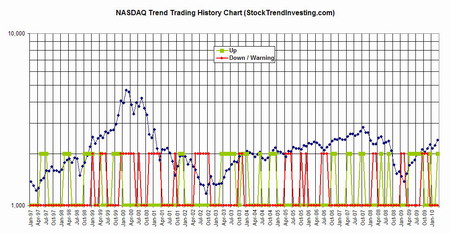
Submitted by Van Beek on April 8, 2010 - 12:24Every month, Stock Trend Investing is publishing one of its historic trend trading charts for free. This month, it is the trend trading chart or the Nasdaq.
The blue line shows the closing price of the Nasdaq index for that month.
The green line signals when our Initial Trend Expectation for the Nasdaq was "Up". The red line signals when our Initial Trend Expectation for the Nasdaq was "Down" or when there was a special warning.
Click and drag the chart to a tab in your browser to see an enlargement.
Trading Strategies
Submitted by Van Beek on March 25, 2010 - 16:37Trading Strategies like Stock Trend Investing offer investors who have little time a proven strategy to get superior returns on the investment of their savings in the stock market.
There are many different trading strategies. The unique element in Stock Trend Investing is that it is specifically developed for people who only want to spend one hour per month on their investments.
Many trading strategies require investors to take action on almost a daily basis. That could be suitable for some, but not for many.
Check out our trend trading blog to see how our strategy fits your expectations.

