Van Beek's blog
EUR/USD Exchange Rate Trend and History Chart: 20 Years
Submitted by Van Beek on June 9, 2010 - 07:26This chart for the EUR/USD exchange rate and trend shows a 20 year history. Since the Euro exists only for about 10 years we had to make some calculations. You will see later below. 20 years provides a unique historic perspective.
Trends in currency exchange rates are important for investors who invest outside their home currency zone. A foreign stock market index could move up but the currency for that market could devalue compared to your home currency. In that case, your gains measured in your home currency would reduce or could even turn negative.
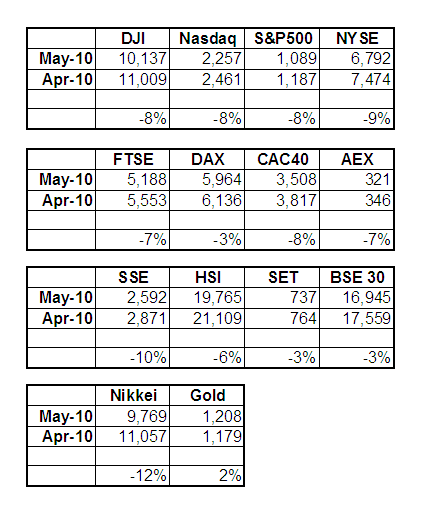
Which stock market indices declined most during May?
Submitted by Van Beek on June 1, 2010 - 08:45How much did the different stock market indices actually decline during May? And which markets declined more, the US markets, the Asian markets or the European markets?
At Stock Trend Investing, we made a quick overview for you to get an answer to these questions. Some of the observations are surprising.

Would you invest at this moment in FTSE index funds?
Submitted by Van Beek on May 26, 2010 - 05:55Markets are in turmoil. But maybe you have some savings that you want to invest. When you are living in the UK you may favour some FTSE index funds for example. However, is it now a good time to invest these savings?
Last week I got a question from a reader on what I thought about investing in the FTSE at this moment. I’ll come back on that later in this blog post. Let me first comment a little on last week. That was a week full of turmoil; not only in the financial markets but also in Bangkok, where I am living at this moment. Because of the unrest in Bangkok and the forced closing of the schools, we decided to go for a week to the beach on Koh Samui; great decision and great week.
BSE Sensex Trend Trading History Chart - April 2010
Submitted by Van Beek on May 18, 2010 - 04:46Every month, Stock Trend Investing is publishing one of its trend trading history charts for free. This month, it is the trend trading chart or the Indian BSE Sensex.
The blue line shows the closing price of the BSE Sensex index for that month.
The green line signals when our Initial Trend Expectation for the BSE Sensex was "Up". The red line signals when our Initial Trend Expectation for the BSE Sensex was "Down" or when there was a special warning.
Find here the analysis on the correlation between the Nifty and the BSE Sensex.
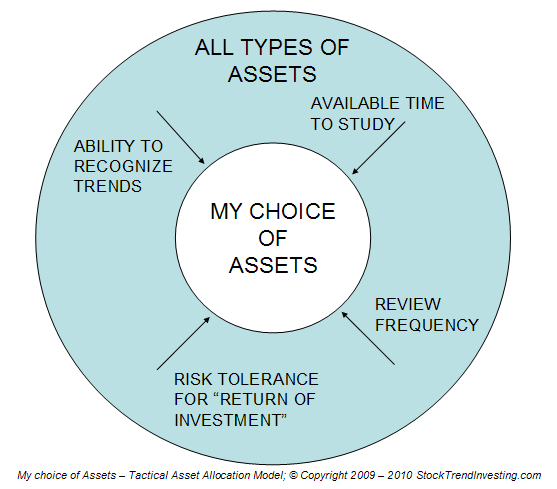
Three key Tactical Asset Allocation Questions Every Investor Should Ask Themself
Submitted by Van Beek on May 16, 2010 - 16:45What percentage of my savings shall I invest in stocks? And what percentage shall I invest in bonds or keep in cash or other investment classes like real estate?
The questions in what to invest and how much of your savings to invest are on the top of the mind of every investor.

Within the coming weeks, we will issue the Stock Trend Investing Tactical Asset Allocation Model. For our Twitter followers we will have a special surprise on this.


