What Monthly Trend Signals Updates Do Members Get
Submitted by Van Beek on January 18, 2014 - 03:07
.Stock Trend Investing members get every month an updated status of the long-term trend direction for a number of major stock market indices in the world.
Get here more information on the stock investing returns when following the MATI trend signal.
Every month at the beginning of the month we assess what the current trend direction is and we share this with our members.
Find out more about how becoming a member by clicking here.
Below you get some unique insight in what we communicated to our members between the beginning of January 2013 and the beginning of December 2013.
Contact us with any questions you have on this.
December 2013
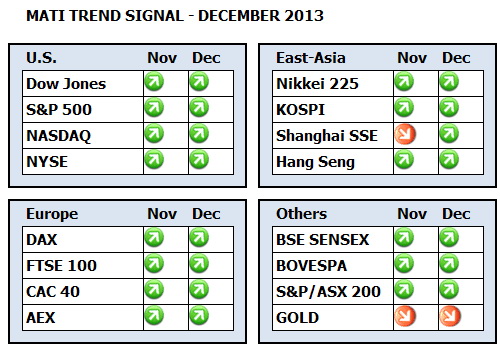
Last month the MATI long-term trend signal for the Chinese Shanghai Composite Index started to point down. At the end of this month, the signal reversed direction again and is pointing up.
This can happen. There is always a trade-off when developing a trend signal between being late and more accurate and early and sometimes subject to more frequent changes in direction. With the MATI signal we have found a good balance in this trade-off. However, it does mean that we do have to check every month what the status is.
Currently the MATI for Gold is pointing down. And the MATI signals for all stock market indices that we follow are pointing up.
Note that most markets have had a considerable run up and the stock index part of your investment portfolio has most likely made some good gains. Do not forget to regularly rebalance your portfolio between the different assets that you hold to lock in some of these gains before there is any potential correction.
During November, the U.S. markets show gains around the 3%. The German DAX was up 4% and the other European markets were up or down a percentage or so. The East Asian markets were mainly up. Especially the Japanese index was up more than 9% during November. Just remember that these gains are also subject to changes in the Yen exchange rate.
Gold, India, Brazil and Australia were all a few percentages down; gold even more than 5% down.
As always, do not hesitate to send me an email with any questions.
November 2013
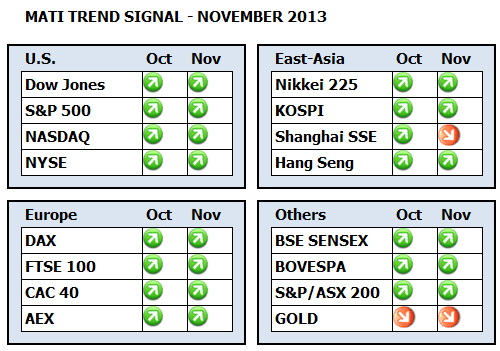
The only change compared to last month is that the MATI long-term trend signal for the Chinese shanghai Stock Exchange (SSE) has started to point down.
The MATI is, just like last month, pointing up for all other covered stock market indices and pointing down for Gold.
Most markets in the U.S., Europe and Australia showed during October a gain of around 4%. Hong Kong and Korea were up over a percent, China down over a percent and Gold was about flat over the period of October. The Indian BSE index gained over 9% during the month.
When you use the MATI for trend following the Chinese market index, you sell your holdings in Chinese index funds now.
October 2013
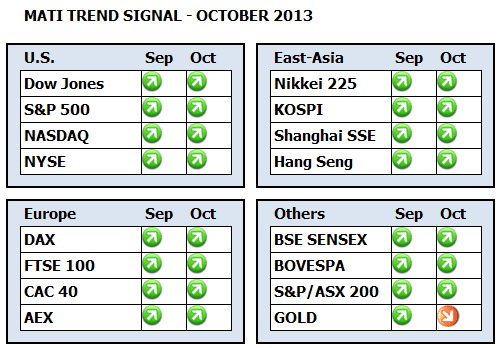
The MATI Trend Signal is pointing up at the end of September for all stock market indices covered by Stock Trend Investing. No change here compared to last month.
The only change compared to last month is that the MATI signal for Gold has started to point down again. When trend following Gold with the MATI signal, you sell your holdings now.
Most markets showed gains during September; especially the emerging markets. Gold is about down what it gained last month. Important market indices in the U.S. and Europe like the S&P 500 and the German DAX reached all-time highs during September.
Given the unchanged MATI signal for the different stock markets, I will keep my exposure and investments to the markets unchanged. Next month we will check the trend direction again.
September 2013
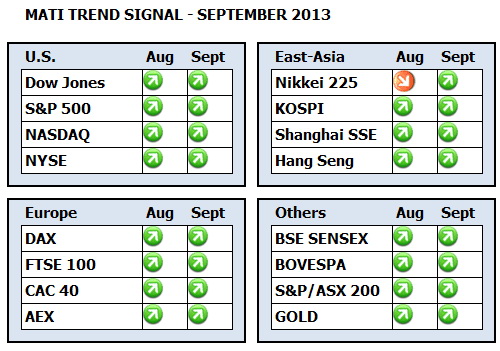
Despite the modest correction in many markets during August, for all markets covered by Stock Trend Investing the MATI signal is currently pointing up. Thus the situation is unchanged except for the Nikkei. Also the MATI for the Japanese Nikkei turned up again.
Gold showed gains of more than 5% (measured in U.S. Dollars) during the month and the MATI is still up. My comments from last month point out a wise lesson to follow the signal and not to try to predict the future. If you count your wealth in Euros, be aware that the MATI signal for the Gold price in Euros is actually still down. Send me an email if you have some questions around this.
Developed markets lost on average about 2% during August. India lost almost 4% while the Shanghai Composite index gained more than 5%, followed by almost 4% in Brazil and 1.6% in Australia.
Given the unchanged situation direction of the MATI signal for most markets, I will keep my personal exposure and investments unchanged.
August 2013
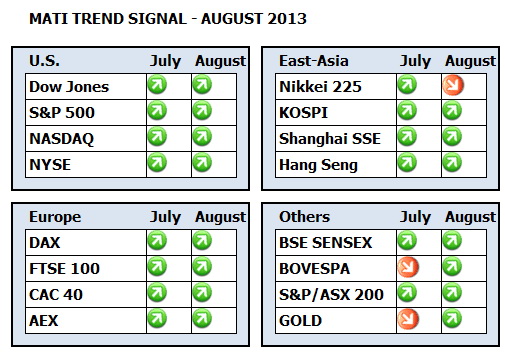
U.S. and European markets and Australia, Hong Kong and Gold showed solid gains of between the 4% and 7% during July. Emerging markets were flat or showed small declines or increases during the month.
For three markets the MATI signal has turned. For the Japanese Nikkei, the MATI has turned down. For the Brazilian BOVESPA and for Gold the MATI has turned up.
However, be aware. Both for the Nikkei and Gold, the MATI signal is in one of those periods that it changes direction multiple times within a short period. This happened for the Nikkei during July. We did some projections for different scenarios for the Gold price for the coming weeks. We see then that even when the Gold price would rise modestly the coming weeks, the MATI signal still would turn down again.
Personally I do not have exposure to the Japanese market (I do have investments is most other Asian markets) and if I would have some, I would exit this market and invest elsewhere. I also do not have exposure to Gold at this moment and do not enter that market yet because of the fluctuating MATI signal.
Most of my own investments are in the U.S., European and Asian (non-Japan) markets and that is where I keep them.
July 2013
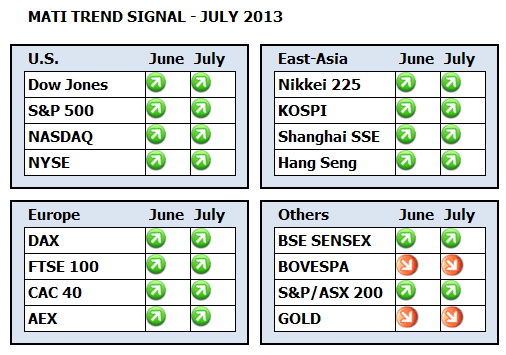
June showed strong fluctuations in most markets. Gold and the markets in Brazil and China lost more than 10%. The U.S. markets lost about 1.5%, Europe 5%, India and Australia 2%, Japan 1% and other East Asian markets around 7%.
After the closing of June, the MATI signal is unchanged for all of the covered markets. For Brazil and Gold, like last month, the MATI points down. For all other markets the MATI points up.
During July, I will keep my personal investments unchanged with exposure to the U.S., European, Australian and Asian markets.
June 2013
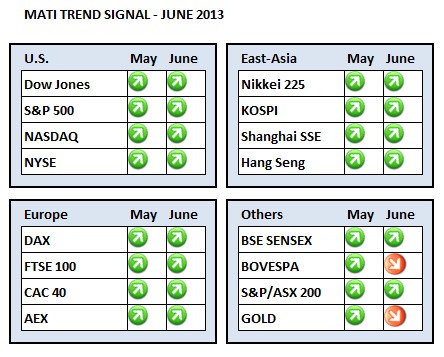
The MATI long-term trend signal has now started to point down for Gold and for the Brazilian BOVESPA.
During May, the U.S. and European indices showed gains. Also the Chinese, Korean and Indian markets increased in value during the month. Japan, Hong Kong, Brazil and Gold decreased.
Thus the MATI signal points now up for all the markets that we cover except Brazil and Gold.
Personally now I do not have any exposure to Gold anymore and never had any to the Brazilian market. I keep my investments in the European, U.S. and Asian markets and will move during June some Euro cash into Asian markets to rebalance my portfolio.
May 2013
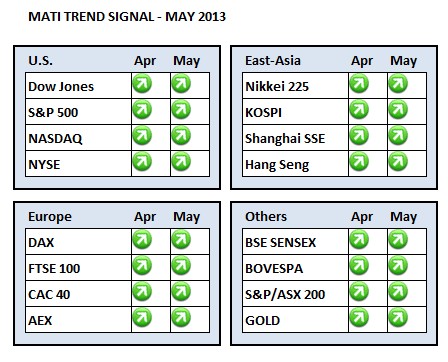
All of our, except four, markets went up during April. For all markets the MATI long-term trend signal is still pointing up. No change here.
The markets that showed declines during April are: Brazil, Shanghai China, South Korea and Gold.
Thus for Gold, measured in U.S. Dollars as usual, the MATI still points up. The recent decline could turn out in a temporary fall-back or in the beginning of a prolonged down-turn. Nobody knows. What I do know is that when you measure the Gold price in Euros, the MATI has started to turn down and is on the edge between up and down. If you invest actively in gold and you measure your wealth in Euros, send me an email and I will give you a more detailed update.
Looking also at some other signals besides the MATI, personally I would limit my exposure to Brazil, China and Korea. Note that I do have exposure to China and Korea in my own investments, but I do not have anything in Brazil. My investments in U.S., German, Dutch and Asia index funds have done well during the last months and I will only sell these when the MATI starts to turn down.
That is not the case now. Like always, contact me with any questions you may have.
April 2013
There is no change in the direction of the MATI trend signal for any of the 16 markets covered by the Stock Trend Investing system. The signal is pointing up for all markets.
During March, the U.S. markets and Japan showed good gains, the European markets showed small gains, and all other markets showed small declines.
The Shanghai Composite Index had a pull-back at the beginning of March, just after we announced that the trend signal had started to point up. That can happen. The signal is still up. Sometimes market movements generate false signals. At this moment it is too early to say if the turn in the direction for the Chinese market last month was a false signal or the start of a long-term up-trend.
Remember that since the MATI for the S&P 500 turned up end of January 2012, the S&P 500 has gained 19.5%. It has been a rocky road, but these are the long-term trends that we want to follow.
For those interested in the currencies, the MATI signal still indicates long-term trend of a stronger Euro versus the U.S. Dollar, despite the recent weakening of the Euro.
Do not hesitate to contact us with any questions or comments.
March 2013
The MATI trend signals for all the 16 markets covered by Stock Trend Investing are pointing up after the closing of February 2013.
Also the MATI for the Chinese Shanghai Composite Index is now pointing up. That is the only change compared to last month.
February 2013
At the end of January 2013, the MATI trend signal was unchanged compared to the end of December for the 16 markets covered by the Stock Trend Investing service.
Thus the long-term trend in all these markets is pointing up except for mainland China.
Most markets made solid gains during January. Note however that the markets with the strongest gains are nominated in a currency that weakened during January compared to other currencies. An example is Japan with the strong gains in the Nikkei but also a weakened Yen.
January 2013
At the end of December 2012, the MATI trend signals are unchanged for the different markets that we cover. For all markets, the MATI points up, except for China.
We are implementing however a few other changes. Based on the feedback from our members, we are simplifying our monthly dashboard and focus on the really important information only. You will see now in one simple overview every month in what markets the long-term trend direction has changed or stayed the same.
The core of the Stock Trend Investing System is the MATI Trend Signal. The MATI has historically the best performance and is more advanced than the other signals that appeared for legacy reasons in our monthly dashboard and charts.
Some of our members gave us the feedback that they thought it was confusing to get a multitude of signals and charts, while the only thing they wanted to look at is the MATI.
Therefore, we start now a 2-month trial during which we use the new MATI-centric dashboard. During the trial we will stop confusing you with the charts for all the other signals and currencies. If you still would like to get these charts, please just contact us via the website or email and we will send them to you.
If you would like to get a graphic overview on how a certain stock market index has performed historically, I would suggest using Yahoo Finance. See one of our latest blog posts with links to the charts for the indices covered by the Stock Trend Investing system.
Please contact us with any questions or comments.

Next & Previous Blog Post
- ‹ previous
- 162 of 174
- next ›
