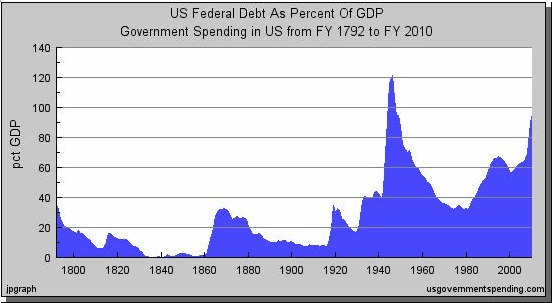
History of US federal debt as percentage of GDP: Why is this now important?
The increase in US federal debt as a percentage of GDP and in absolute terms is unprecedented and could therefore be a major risk for long term investors.
In this article we will see how the US federal debt has developed as a percentage of GDP for the last two centuries. We will point out why the growth is unprecedented even when the debt percentage has been higher in the past.
The next article following this one is about what is ahead for the US Dollar.
Why investors need to know
This article is the first in a series that investigates and summarizes public debts, public deficits, the risk in yields for government and corporate bonds, possible scenarios for the next ten years and the impact this all can have on long term and trend investors.
We believe that trend and long term investors need to have a basic but correct understanding of the economic environment in which they are living. Having this understanding provides them with better insight in the possible risks and the investing climate for the decade to come.
Once one knows what might be coming, investors can prepare themselves for the different possible scenarios. They will keep their eyes wide open and recognize the signals that tell them which of the possible scenarios are actually unfolding. Being prepared and knowing what one might expect, gives us peace of mind as well.
To start with the understanding of our economic environment lets have a look at the history of the US debt as a percentage of GDP.
US Federal Debt and War
The chart above shows the US federal debt as a percentage of GDP for the period 1792 to 2010. At first sight, one can conclude that current debt levels are not unusual since debt levels as percentage of GDP were even higher in the 1940s and 1950s. In absolute terms, debts are of course much higher now, but since the economy has expanded that much, it is more relevant to look at the debt as a percentage of GDP.
So, why is then the debt as percentage of GDP unprecedented now? The last increase in debt levels started in 1980. The previous 4 periods during which debt levels increased substantially were in the 1860s, the 1910s, 1930s and the 1940s. The increase during the 1930s was the attempt to spend the US out of the Great Depression. All the other periods were periods of dramatic war that required massive spending to survive and win: the Civil War, World War 1 and World War 2.
You might say that the US is now at war as well with the “war on terror” and the missions in Iraq and Afghanistan. With the following arguments we want to show that the current build up of debt is unprecedented since it has nothing to do with war or spending us out of a great depression.
Three reasons why war has nothing to do with it
- The cost of the current wars is peanuts compared to the costs of the other wars when looking at them as a percentage of GDP. The Iraq war is costing about 1% of GDP. WW1 was costing 3% of GDP and WW2 was costing 16% of GDP. Thus when comparing with the two world wars and comparing the debt in 1980 with the one in 1910 (periods without war and low debt), one would expect a debt below the 45%. However, the current US federal debt as percentage of GDP is around the 90% and growing.
- During the 1950s and 1970s, the US was fighting wars in Korea and Vietnam that were costing each about 2% of GDP. At the same time, the US was in the cold war and weapons race with the Soviet Union. But the debt decreased from about 120% in 1945 to below 40% of GDP in 1980.
- The financial crisis happened in 2008. Between 1980 and 2008, debt already increased from around 35% to above the 60%.
Thus since 1980, the US federal debt as percentage of GDP has increased to levels that are very, very high and unprecedented in history since they are not caused by war.
Note that we do not judge if it is good or not to have these debt levels. That requires a completely different level of analysis.
But in coming articles, we will look at the risks that these debt levels could bring to the economy and investors and how they compare with other countries.
One comment that we want to make now already is that the US managed between 1945 and 1980 to decrease its debt percentage mainly by growing its economy. The growth predictions for the coming decade are not that high.
Read Also Our Other Popular Posts on the Economy
- Why is the Japanese Yen so Strong
- Factors contributing to Economic Growth and Causes for Recession and Economic Crisis
- Debt or Deficit: are we into trouble compared to other countries?
- Why is China Facing Inflation?
Next & Previous Blog Post
- ‹ previous
- 38 of 174
- next ›


