Nasdaq Historic Trend Trading Chart - March 2010
Submitted by Van Beek on April 8, 2010 - 12:24Every month, Stock Trend Investing is publishing one of its historic trend trading charts for free. This month, it is the trend trading chart or the Nasdaq.
The blue line shows the closing price of the Nasdaq index for that month.
The green line signals when our Initial Trend Expectation for the Nasdaq was "Up". The red line signals when our Initial Trend Expectation for the Nasdaq was "Down" or when there was a special warning.
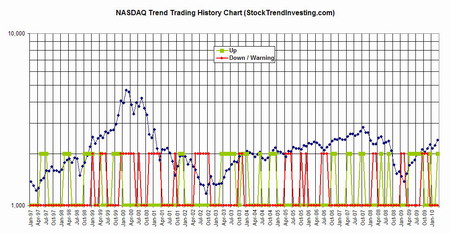
Click and drag the chart to a tab in your browser to see an enlargement.
Did you claim your free copy of this new investing eBook already?
Submitted by Van Beek on April 1, 2010 - 14:26Earlier this week we have published our new Stock Trend Investing eBook. This eBook is at this moment freely available for those who sign up for our newsletter, which is actually free as well.
The title of the eBook is “Superior Stock Investing Results and Peace of Mind in One Hour per Month”. It is an extensive introduction to and background for the Stock Trend Investing website.
 It tells the story how and why I came to Stock Trend Investing system; to explain the journey of a decade that I have taken to get where we are.
Comments on Book "Superior Stock Investing Results"
Submitted by Van Beek on March 29, 2010 - 18:42Stock Trend Investing had published the book "Superior Stock Investing Results and Peace of Mind in One Hour per Month". Our readers are encouraged to post here their comments and questions on this book.
We will do our best to answer all your questions that are posted here as comments.

The eBook version links to the following polls on this website. Feel free to visit these polls, answer them and see how the other readers have answered them on average.
How many hours you want to spend maximum per month on your stock market investments?
What is the best week of the month to trade index funds
Submitted by Van Beek on March 23, 2010 - 04:05Does it make a difference during which week of the month you buy or sell your index funds? At Stock Trend Investing we dived into the data and present you here with our conclusions.
We haven’t just looked at every month during the last 13 years. We have also looked specifically at the months that follow directly an “Up” or “Down” trend expectation from Stock Trend Investing. The results are different for each of the considered cases.

Trading currencies or how to deal with currency fluctuations
Submitted by Van Beek on March 17, 2010 - 02:51There is a recent trend that non-professional investors step into the currency trading. The major shifts that the US dollar has made versus the Euro during the last year are probably the reasons for this. Why should you be very, very careful before starting to trade in currencies and what can be the impact of currency fluctuations on investors in stocks and funds.
The exchange rate between currencies is developing 24 hours per day. This exchange rate is the price you need to pay in one currency for another. For example, at the time of writing, one needs to pay 1.37 US dollar for every 1 Euro.