Foreign Holding of US Treasury Securities: a 10 year historic overview
Submitted by Research on February 17, 2010 - 09:01
Foreigners cut Treasury stakes; Rates could rise. This was the article in Yahoo Finance from February 16 based on a press release from the US Treasury that lead me to dive a little more into the foreign holding of US treasury securities. This article shows the historic graphs and my findings, like the chart below.
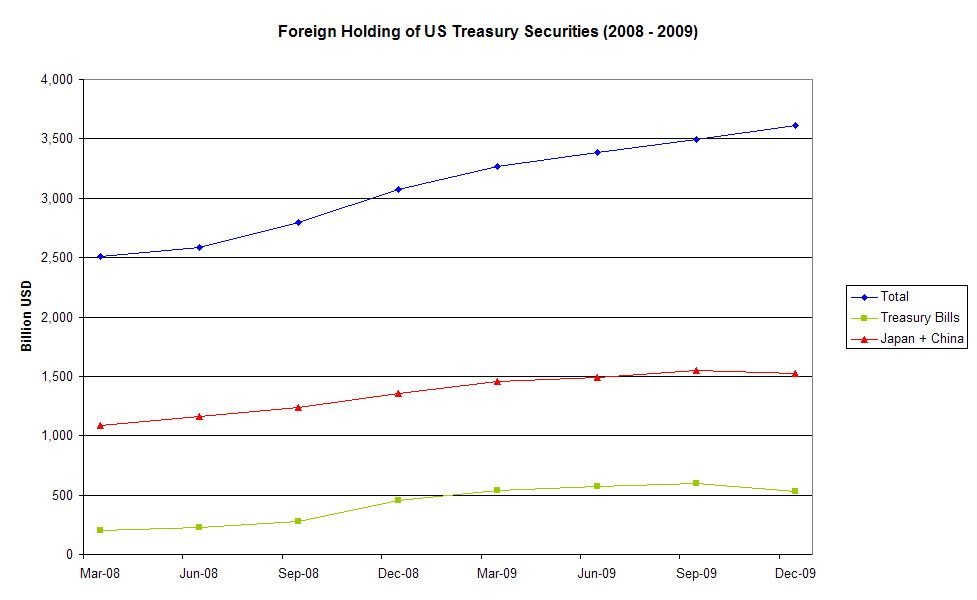
Foreign holding of US Treasury Securities 2008 - 2009
The previously mentioned article in Yahoo is a typical article. It just looks at what happened in the last month that the figures are available and it points out what the record in the month-on-month changes.
At Stock Trend Investing, we always like to look a little a longer trends and pattern to place last month changes into a context.
Therefore, we looked at the last 10 years, from 2000 to 2009 and what trends we could discover in the foreign holding of US treasury securities. The data we are using here is coming from the official website of the US Department of the Treasury.
Japan and China
The chart above shows how the holding of US Treasury Securities by Japan and China, taken at the end of each quarter in 2008 and 2009. Japan and China combined seem to support the overall growth of the foreign owned securities, except for during the last quarter of 2009.
The above mentioned Yahoo article talked about the biggest drop in Treasury bill holding during last December compared to November. Yes, the holding of treasury bills dropped end of Q4 2009 compared to the quarters before, but is still substantial higher than in 2008 for example.
But to place these developments into further perspective, lets look at the developments in the foreign holding of US Treasury Securities during the last 10 years, from 2000 to 2009.
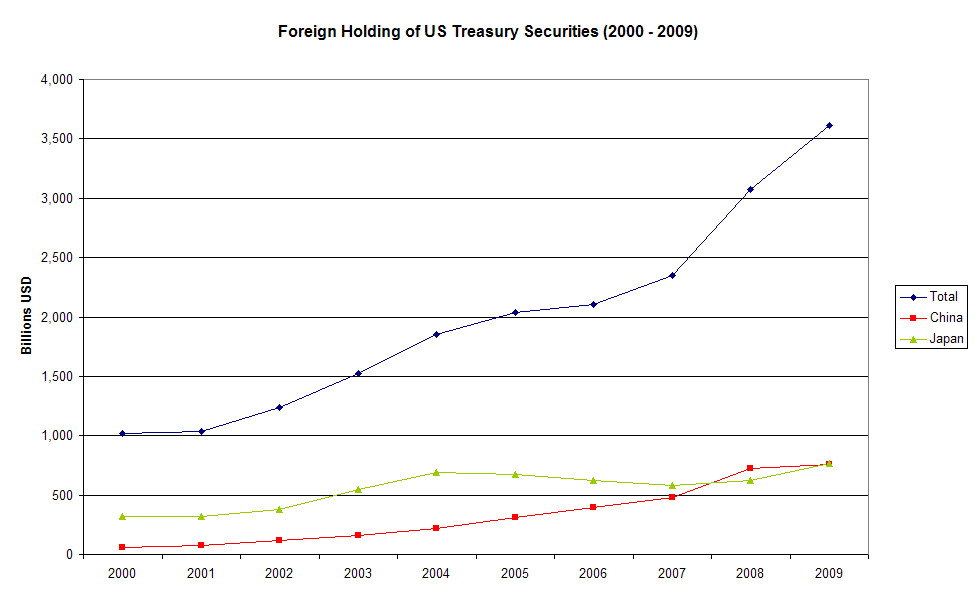
Foreign Holding of US Treasury Securities 2000 – 2009
The chart below shows us the following:
- China is steadily increasing its holding of US Treasury Securties during the last 10 years, but the growth is leveling off during 2009.
- Japan increased its holdings rapidly during 2003 and 2004, reduced them gradually during 2005, 2006 and 2007, start increasing them during 2008 and brought them in 2009 to a record level.
- Overall, the foreign holding of US Treasury Securities more than trippled in 10 years.
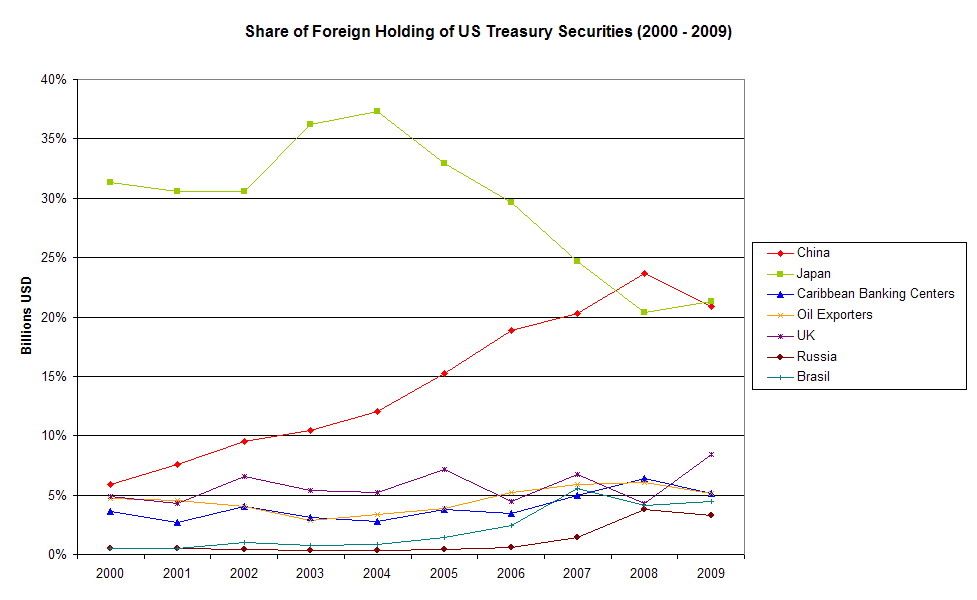
But in a chart like this where everything is increasing, it is difficult to see how the importance of a certain holder of the tresury securities is changing over time. Therefore, have a look at the chart below that shows how the shares in the foreign holding of different major holders have developed during the last 10 years.
Our five observations regarding the last decade
- China’s share was steadily incresaing from 6% in 2000 and has peaked in 2008 with 24%. During 2009 it reduced to 21%.
- Japan’s share was steady around 31% at the beginning of the decade and incrased then in 2 years to its peak of 37% in 2004. The following 4 years, its share was gradually reduced to 20% and increased in 2009 slightly again to 21%, about the same as China.
- The share of the UK was during the last 10 years in general between the 4% and 7% of the total. Remarkable is the doubling during 2009 to 8% compared to the 4% end 2008.
- The Caribbean banking centres and the Oil exporters have increased their holdings during the second half of the decade slightly compared the first half
- However, Russia and Brasil had from an overall perspective neglecatble holdings at the beginning of the decade,but count together by end 2009 for about 7% of the total.
Questions one could ask oneself when seeing this and for which I do not have the answer:
- Is bringing the share from Japan down from an increadible high (and risky?) 37% in 2004 to the 21% in 2009 a deliberate plan from someone in Japan or the US Treasury or just the way how things go?
- Is it just coincidence that Japan and China are having roughly the same weight at this moment just above the 20%, or is this targeted situation that seems much more stable than having one party owning 37%?
- What does it mean that end 2009, the UK holdings are 131% higher than end 2008?
Your comments and input on this are welcome.
Treasury Bills
Finally, lets have a look at the development in Treasury Bills during the last 10 years.
See below the chart on the Foreign Official Share of Foreign Holdings of US treasury Secuirities for 2000 – 2009 as published by the US Treasury.
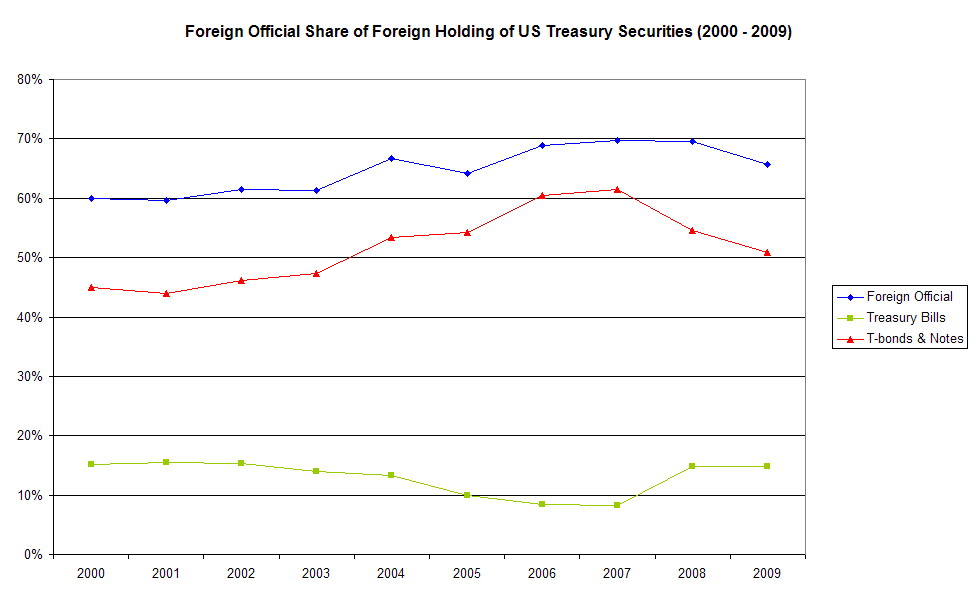
Our observations is that Treasury Bills cover at this moment a similar percentage of the total foreign holding of US Treasury Securities than 10 years ago. Even when there was a big drop last December, the overall situation does not seem extra ordinary.
The excel document that is attached to this article at Stock Trend Investing for registered and logged-in users, contains the charts published in this article and the data behind these charts.
So, could the drop in the foreign holdings of Treasury Bills and the fact that Japan is again a larger foreign holder of US Treasury Secuities indicate that interst rates on the US debt could rise? We do not have the answer, but our objective was to put the recent developments in a little wider context.
Your opinions are welcome. Please comment on this article.

Next & Previous Blog Post
- ‹ previous
- 19 of 174
- next ›
