January 2011
How Also You Can Outperform the Stock Market with Sun Tzu’s Art of War
Submitted by Van Beek on January 25, 2011 - 16:27Sun Tzu teaches us in the Art of War about the basics of Trend Investing
Sun Tzu was a Chinese military strategist in the 6th century BC. He wrote the famous book “Art of War”. The book has 13 chapters, each dedicated to a different aspect of warfare. What has this to do with outperforming the stock market, you may ask.
In Chapter 10, Sun Tzu gives us the answer: “He who knows when he can fight and when he cannot, will be victorious.” This quote has been the secret behind how also you can outperform the stock market.
Free Gift for Facebook Likes
Thank you for giving the Stock Trend Investing Facebook Page your "Like".
 You can download now your free report at the bottom of this page.
How to Get Better Annualized Returns from Your S&P 500 Index Funds?
Submitted by Van Beek on January 17, 2011 - 10:57
Click here for the latest S&P 500 trend investing and long-term market timing signals.
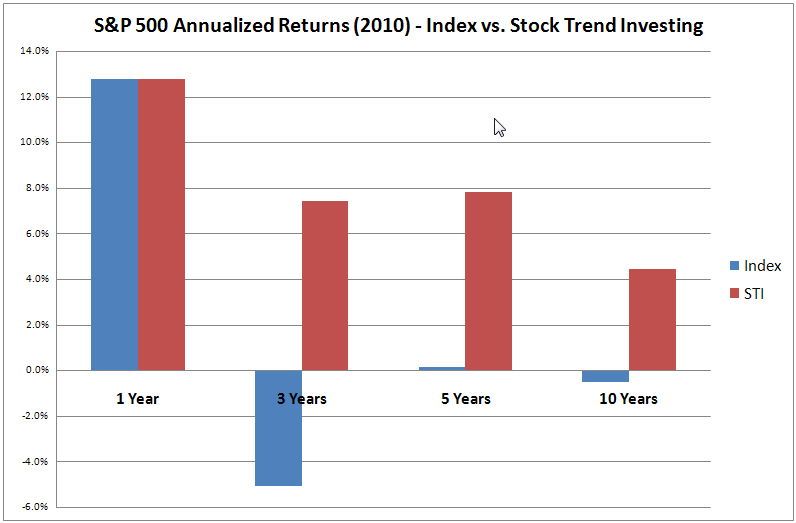
The return of the S&P 500 over 2010 was good: 13%. However, the annualized returns of the S&P 500 for the last 3, 5 or even 10 years are very poor. Just buying and holding an S&P 500 index fund does not make financial sense. However, with trend investing and long-term market timing, investing in the S&P 500 does start making sense.
SP500 Performance History

In the beginning of 2000, I had a close look at the SP500 performance history. The conclusion was clear. I had to start investing in the stock market. I was making a decent salary, but all my friends were making a fortune with their stock market investments.
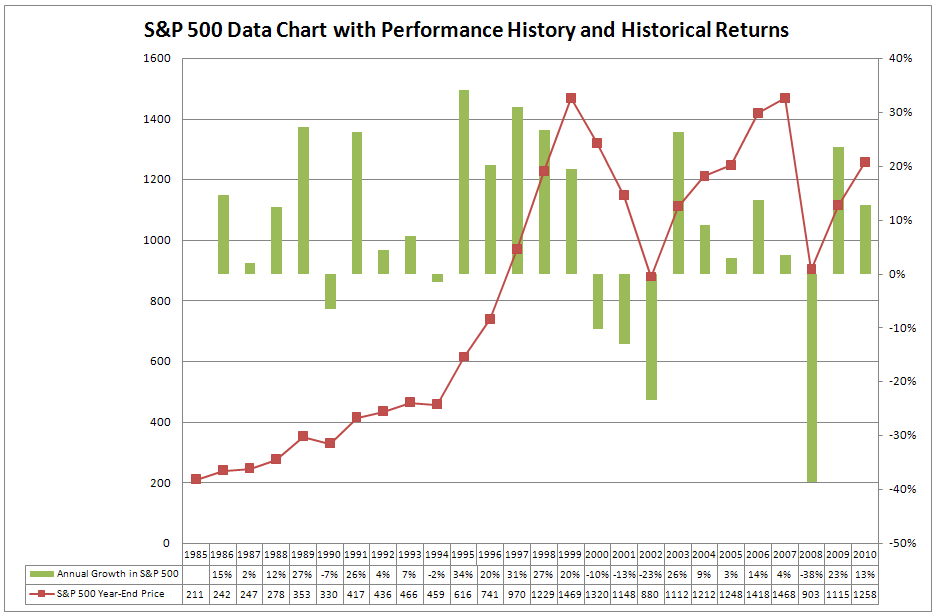
It was time that I started to invest my savings in the stock market as well. I took action. The rest is history. The performance of the SP500 in the year 2000 was a minus 10%.
SP500 Data Chart

In January 2000, I took a good look at the SP500 data chart. The conclusion was obvious. I had to start investing in the stock market. My salary was fine but everyone around me was making a fortune more in the stock market.
Standing idle was no longer an option for me and I started to invest my savings in the stock market. That did not turn out well as you can see in the chart. The SP500 data shows for the year 2000 a result of minus 10%.
The SP500 data in the chart above shows also that during 1990 and 1994, the SP500 turned negative and that these years were followed by years with excellent results. With this data in mind, I had nothing to fear. Reality proved me wrong.
Historical SP500 Returns

To see a larger version of this historical SP500 returns chart, download the attachment at the end of this page or click and drag the chart to a new tab in your browser.
When I reviewed in January 2000, the historical SP500 returns, I came to the conclusion that I was mad not investing in the stock market. I was earning a good wage. But my friends were making way much more money with their stock market investments.
I could no longer stand on the sideline and started to invest my savings in the stock market. We all know what happened after that. The returns of the SP500 in the year 2000 were a minus 10%.
Our General Rules for Investing
Submitted by Van Beek on January 7, 2011 - 11:34As a smart investor, you need to set a number of rules and guidelines for yourself to which you will adhere.
Here are our rules.
- We do not invest in individual stocks but only in index funds and low-cost mutual funds with a good track record.
- We only invest our savings that we do not need for at least 5 to 10 years. We never borrow money to invest in the stock market.
- We limit our exposure to foreign markets/currencies that show a declining trend to our home currency to a certain percentage of our overall savings that we have earmarked for investing in the stock market.
Read here more about how we handle and which free tool we use for Money Management.
Acting Upon the Trend Signals
Submitted by Van Beek on January 7, 2011 - 11:28As an informed investor, you can decide for yourself how you will act upon the different Trend Signals.
Important here is that you are consistent in how you act upon the signals.
One central aspect of Trend investing and Long-term Market Timing is to take the emotions out of the investing decisions. The signals are objective and results of calculations.
Therefore it is vital for long-term success that you decide beforehand how you will act and that you act accordingly.
At Stock Trend Investing, we follow these rules for our personal investments:
Coppock Buy Signal (CBS)
Submitted by Van Beek on January 7, 2011 - 11:22The Coppock Buy Signal (also “Coppock Curve” or “Coppock Indicator”) is an indicator for long-term stock market investors created by E.S.C. Coppock, first published in Barron's Magazine in October 15, 1962.
The indicator is designed for use on a monthly time scale. It's the sum of a 14-month rate of change and 11-month rate of change, smoothed by a 10-period weighted moving average.
Coppock provides only a “Buy” signal and no “Sell” signal.
You can expect the Coppock Buy Signal (CBS), like the MATI, to provide earlier “Buy” signals than the other Moving Averages Signals, especially after a major and longer down-turn. The CBS does not always give a “Buy” signal after shorter and less deep down-turns.


