Technical Analysis 101: How To Identify Supply & Demand in the Forex Market
Submitted by Guest on October 29, 2010 - 06:45
Traders who speculate in financial markets generally employ one of two types of market analysis. The first is fundamental analysis. Fundamental analysis is the analysis of economic and financial conditions that directly affect the price of a financial product (stock, commodity, or currency). Then, traders take positions in the market based on this analysis.
Small, private traders are at a large disadvantage in relation to fundamental analysis. The average hedge fund or bank trading floor employs and entire team of financial analysts to conduct fundamental analysis in order to determine trading opportunities. These teams then give the trading opportunities to the traders who actually take positions in the market.
Private traders, on the other hand, have to do this all themselves, and they do not usually have access to the same level of information that large financial institutions do. Therefore, most private traders tend to rely heavily on technical analysis in order to determine trading opportunities, and many use fundamental analysis to simply gauge and track the overall bias of the market as a whole.
Technical Analysis Defined
Technical analysis is the analysis of price as represented on a chart. Traders use a multitude of technical indicators and apply them to historical prices based on the assumption that historical evidence may offer insight into future price direction. This is a challenge, however, because it is proven that historical results are not necessarily an indication of future price movement; therefore, technical traders are simply trading based on probability.
Purpose of Technical Analysis
The basic purpose of technical analysis is to discover areas of supply/demand imbalance in the market. If a trader can discover where buyers will be heavily present with demand or where sellers will be heavily present with supply, then he can take positions in the market accordingly. There are literally thousands of indicators that traders can use in technical analysis, and there is really an ever-increasing number because traders are always inventing and coding out new indicators.Trendlines are one of the most common tools of technical analysis. The best forex course will usually discuss them in-depth.
Trendlines
These are lines that connect successive LO’s or successive HI’s, and when drawn properly, they give a trader valuable insight into supply/demand areas on a chart.
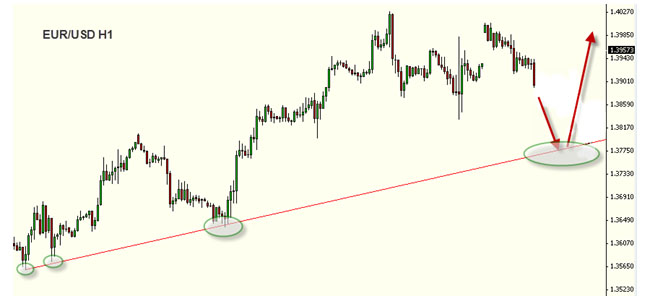
The chart above has a trendline running along the successive lows of the trend. You can see in each of the green circles that price has touched the trendline and then moved up considerably. Therefore, there is a strong measure of demand along this trendline. Each time price comes to it, buyers come into the market quite aggressively and push price up considerably. Now that we have drawn this trendline, we can see that as price continues to move down to the trendline, there is a strong possibility it may bounce again due to continued demand. Let’s see what happened:
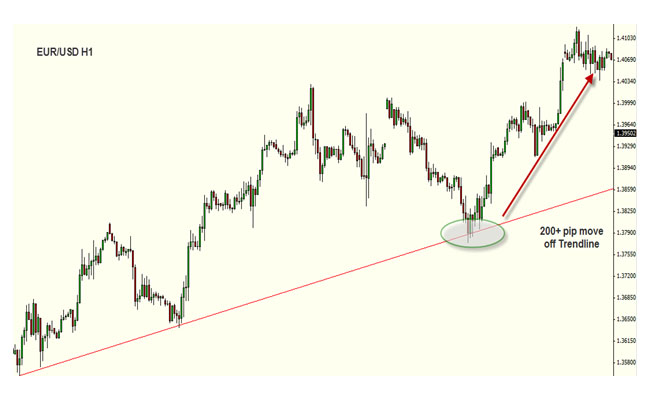
As price moved down to the trendline, buyers came into the market again and price moved up over 200 pips.
Broken Trendlines
Trendlines are primarily used to fade price in the forex market, meaning that as price comes to a trendline, you are looking for it to bounce off the trendline and go in the opposite direction. For example, in the chart above, price was moving down the trendline, but each time it touched it, price moved back up. This is the standard use of trendlines. However, at times trendlines will not hold price, and price will break right through. In these scenarios, a trader can let price break through the trendline; then, as price comes back up to the broken tendline to retest it, the trader can fade price. Let’s see an example:
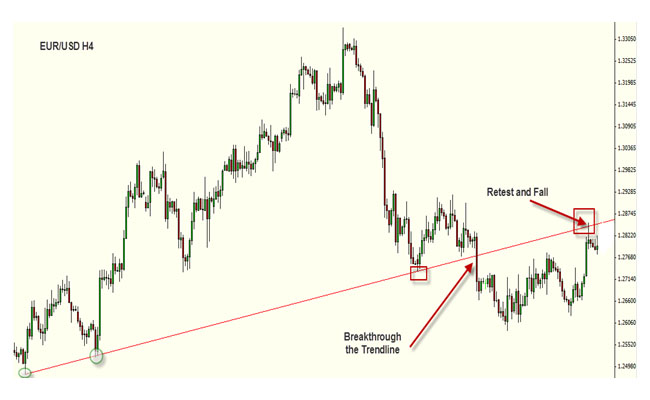
You can see that price has respected the trendline 3 times. On the 4th touch, price breaks through. When this happens, you want to use the trendline as resistance when it comes back up. In this example, a short at the trendline retest would have yielded a quick 70+ pip profit. Yet again, past performance analysis holds a high level of uncertainty as relationships may break and other factors can rapidly turn a possible profit into a large loss.

