- End of 12 Years of Monthly Stock Market Trend Updates
- Alternative Services for Trend Signals
- S&P 500 Trend Signal Email Alert
- Two Favorite Economics and Investment Newsletters
- Get Email Alert When S&P500 Trend Turns Down
- Currencies Impact Stock Market Profits
- Trend Investing Whip-Saw Reality
- Not Trend Following But Trend Investing
- How to Invest My Savings Safely for Good Long-Term Returns?
- Does Trend Trading the ASX Work?
Forex
The “EUR/USD” Currency Pair is Experiencing “Limbo-Land” at Present
March 2, 2011 - 04:43 — ResearchMarket conditions seem to be as ambivalent as the weather these days. Last year was marked by uncertainty and turmoil, resulting in volatility that had not been seen since the end of 2008. However, recently stocks and commodities have been rising like crazy over the past seven months, and volatility has been squeezed out of the currency markets and hit new 3-year lows in the S&P 500 Index.
The Euro fell from its lofty perch last May due to debt and deficit issues with its smaller member states, but versus the Dollar, it seems trapped at the moment in a kind of limbo-land.
What is ahead for the US Dollar given the large Current Account Deficit
September 30, 2010 - 05:35 — Van BeekThe Current Account deficit for the US is at this moment $123 billion per quarter and 3.3% of GDP. This is less than the 6% in 2006 but still at a level that most economists consider to be unsustainable in the long term. The decline is probably caused by the economic situation and could be temporary. So, what does this mean and what is ahead for the US?
In this article we focus on what the consequences could be for the US given its large Current Account deficit and the factors that are driving this deficit.

Why is the Japanese Yen so Strong
September 9, 2010 - 14:04 — Van BeekThe question on why the Japanese Yen is now so strong against the U.S. Dollar is asked repeatedly the last few weeks, months and years.
The Yen reached recently a 15-year high against the Dollar. Was this in line with expectations? What is happening and what is causing this? Here are the analysis and conclusions on why the Yen is so strong.
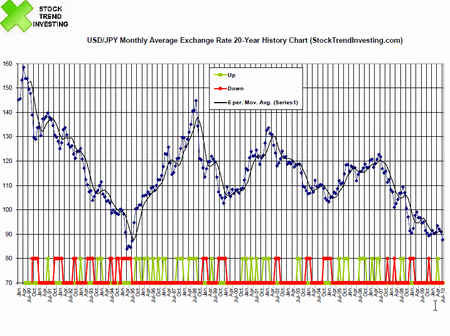
USD/JPY 20-Year Exchange Rate Trend and History Chart - July 2010
August 10, 2010 - 01:55 — Van BeekThis USD/JPY exchange rate and trend chart shows a 20 year history. The US Dollar - Japanese Yen exchange rate is a lot in the news recently since a Dollar buys less and less Yen's. This is the historic perspective. The trend just continues. Click now here to see the historical trend investing performance and what level of results you can expect.

EUR/USD Exchange Rate Trend and History Chart: 20 Years
June 9, 2010 - 06:26 — Van BeekThis chart for the EUR/USD exchange rate and trend shows a 20 year history. Since the Euro exists only for about 10 years we had to make some calculations. You will see later below. 20 years provides a unique historic perspective.
Trends in currency exchange rates are important for investors who invest outside their home currency zone. A foreign stock market index could move up but the currency for that market could devalue compared to your home currency. In that case, your gains measured in your home currency would reduce or could even turn negative.
Trading currencies or how to deal with currency fluctuations
March 17, 2010 - 01:51 — Van BeekThere is a recent trend that non-professional investors step into the currency trading. The major shifts that the US dollar has made versus the Euro during the last year are probably the reasons for this. Why should you be very, very careful before starting to trade in currencies and what can be the impact of currency fluctuations on investors in stocks and funds.
The exchange rate between currencies is developing 24 hours per day. This exchange rate is the price you need to pay in one currency for another. For example, at the time of writing, one needs to pay 1.37 US dollar for every 1 Euro.

